Recently I was researching Babe Ruth, something I do every so often, and as I was doing so, I began to daydream and thought how great it would have been to see the Babe step in against Walter Johnson. And then my mind began to wander, and I wondered about Ted Williams facing Bob Feller; or how about Josh Gibson staring down Satchel Paige. And then I wondered how they did against each other? So, of course I set about to find out.
So how do you think a couple of All-Time Greats would fare against each other?
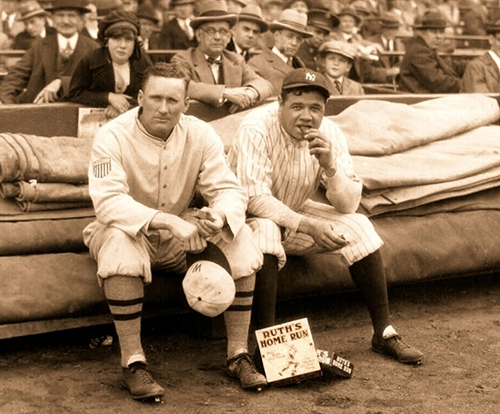
Walter Johnson and Babe Ruth, two of baseball’s most dominant players.
Let’s take a look. In 136 at bats, Babe hit .324 with 14 doubles, 2 triples and 10 home runs. He walked 28 times giving Babe an on base percentage of .442, and Ole Walter punched him out 26 times. Not bad, but let’s take a closer look. Babe hit .342 lifetime but Johnson held him 18 points under his lifetime mark. In his career, his home run to at bat ratio was 1 homer in every 11.76 at bats; against Johnson he hit a homer in every 13.6 at bats. Babe whiffed 1 in every 6.43 at bats but when he faced the Big Train, he went down swinging once every 5.23 at bats. Babe’s numbers against Johnson were pretty damn good however, in essence, the Big Train reduced the Sultan of Swat to a mere mortal.
However, there is a flip side. Throughout Johnson’s career, opponents hit .222 against him. He surrendered a total of, ready for this, 97 home runs. THAT’S IT!! That translates to a home run every 227.2 batters! The on base percentage of opposing batters throughout Johnson’s career was .281. So, if you consider that Babe took him deep once every 13.6 at bats and hit him at a .324 clip and got on base 44% of the time then one could conclude that Babe reduced the great Big Train Walter Johnson to a mere mortal as well.
How about Teddy Ballgame and Rapid Robert Feller?
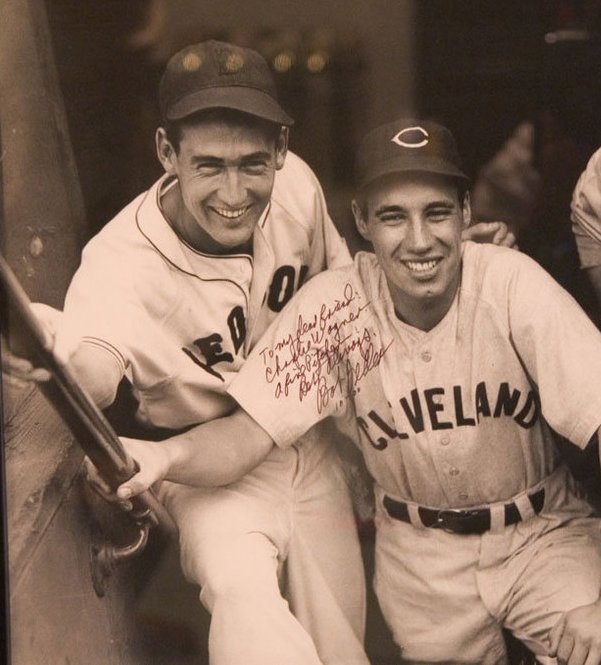
Williams stepped in to face Feller 186 times.
The outcome of their matchups was very interesting. William’s lifetime average was .344 and he hit a home run every 14.79 at bats. His slugging percentage was .634 and his on base percentage was a major league leading .482. He struck out once every 10.86 times he batted. His performance against Feller was overall better and, in some categories, significantly better. He hit .349 against him with a home run every 14.9 times he faced him. His on base percentage was .478 and his slugging percentage was .685, 51 points higher than his lifetime mark. And he struck out once every 12.41 times against the Heater from Van Meter, nearly two more at bats more than his career mark.
The flip side is that Bob Feller’s opponents hit only .228 against him in his 18-year career, 121 points lower than Williams hit against him. He struck out a batter every 5.56 at bats, a seven at bat differential between Ted and the rest of his opponents. And he surrendered a home run once every 64.08 times an adversary stepped into the batter’s box. Ted got him four times more than everybody else. Williams’.478 on base percentage against Feller was 163 points higher than the .315 mark he had against all his career opponents.
What can you conclude from all this? Ted Williams could hit! And he loved to hit against Bob Feller.
My mind wandered forward and as the matchups tumbled through my brain, I had to keep going; Koufax vs Mays, Aaron vs Gibson, Mantle vs Lemon….. I was off and running and so come along with me!
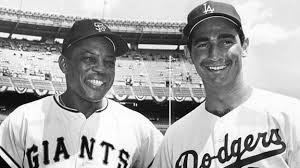
The Say Hey Kid had 97 at bats against the Left Hand of God.
Willie Mays was a lifetime .302 hitter. On his way to 660 career home runs he homered every 16.48 at bats. He struck out every 7.13 at bats and his lifetime on base percentage was .384 with a slugging percentage of .557.
Throughout the career of Sandy Koufax, opponents hit a paltry .202 against him and batters took his offerings out of the park every 42.4 at bats. Their collective on base percentage against him was .273 and he struck out a batter once in every 3.62 at bats!
When they faced off it went like this; Willie hit .278 with 8 doubles, 1 triple and 5 home runs. He walked 25 times and struck out 20 times. His .426 on base percentage was 42 points higher against Koufax while his .536 slugging percentage was 21 points lower. He took a Koufax offering out of the park once every 19.4 at bats and he whiffed once every 4.85 at bats, both considerably lower than what he did for his career. Looking at it from the flip side, Mays’ average was 76 points higher than the career mark of Koufax opponents. His on base percentage was 153 points higher and his strike out to at bat ratio was a full 1.13 better than what Sandy did against everybody else.
Conclusion? Sometimes you eat the bear and sometimes the bear eats you!
How about the Indians Bob Lemon and the Mick?
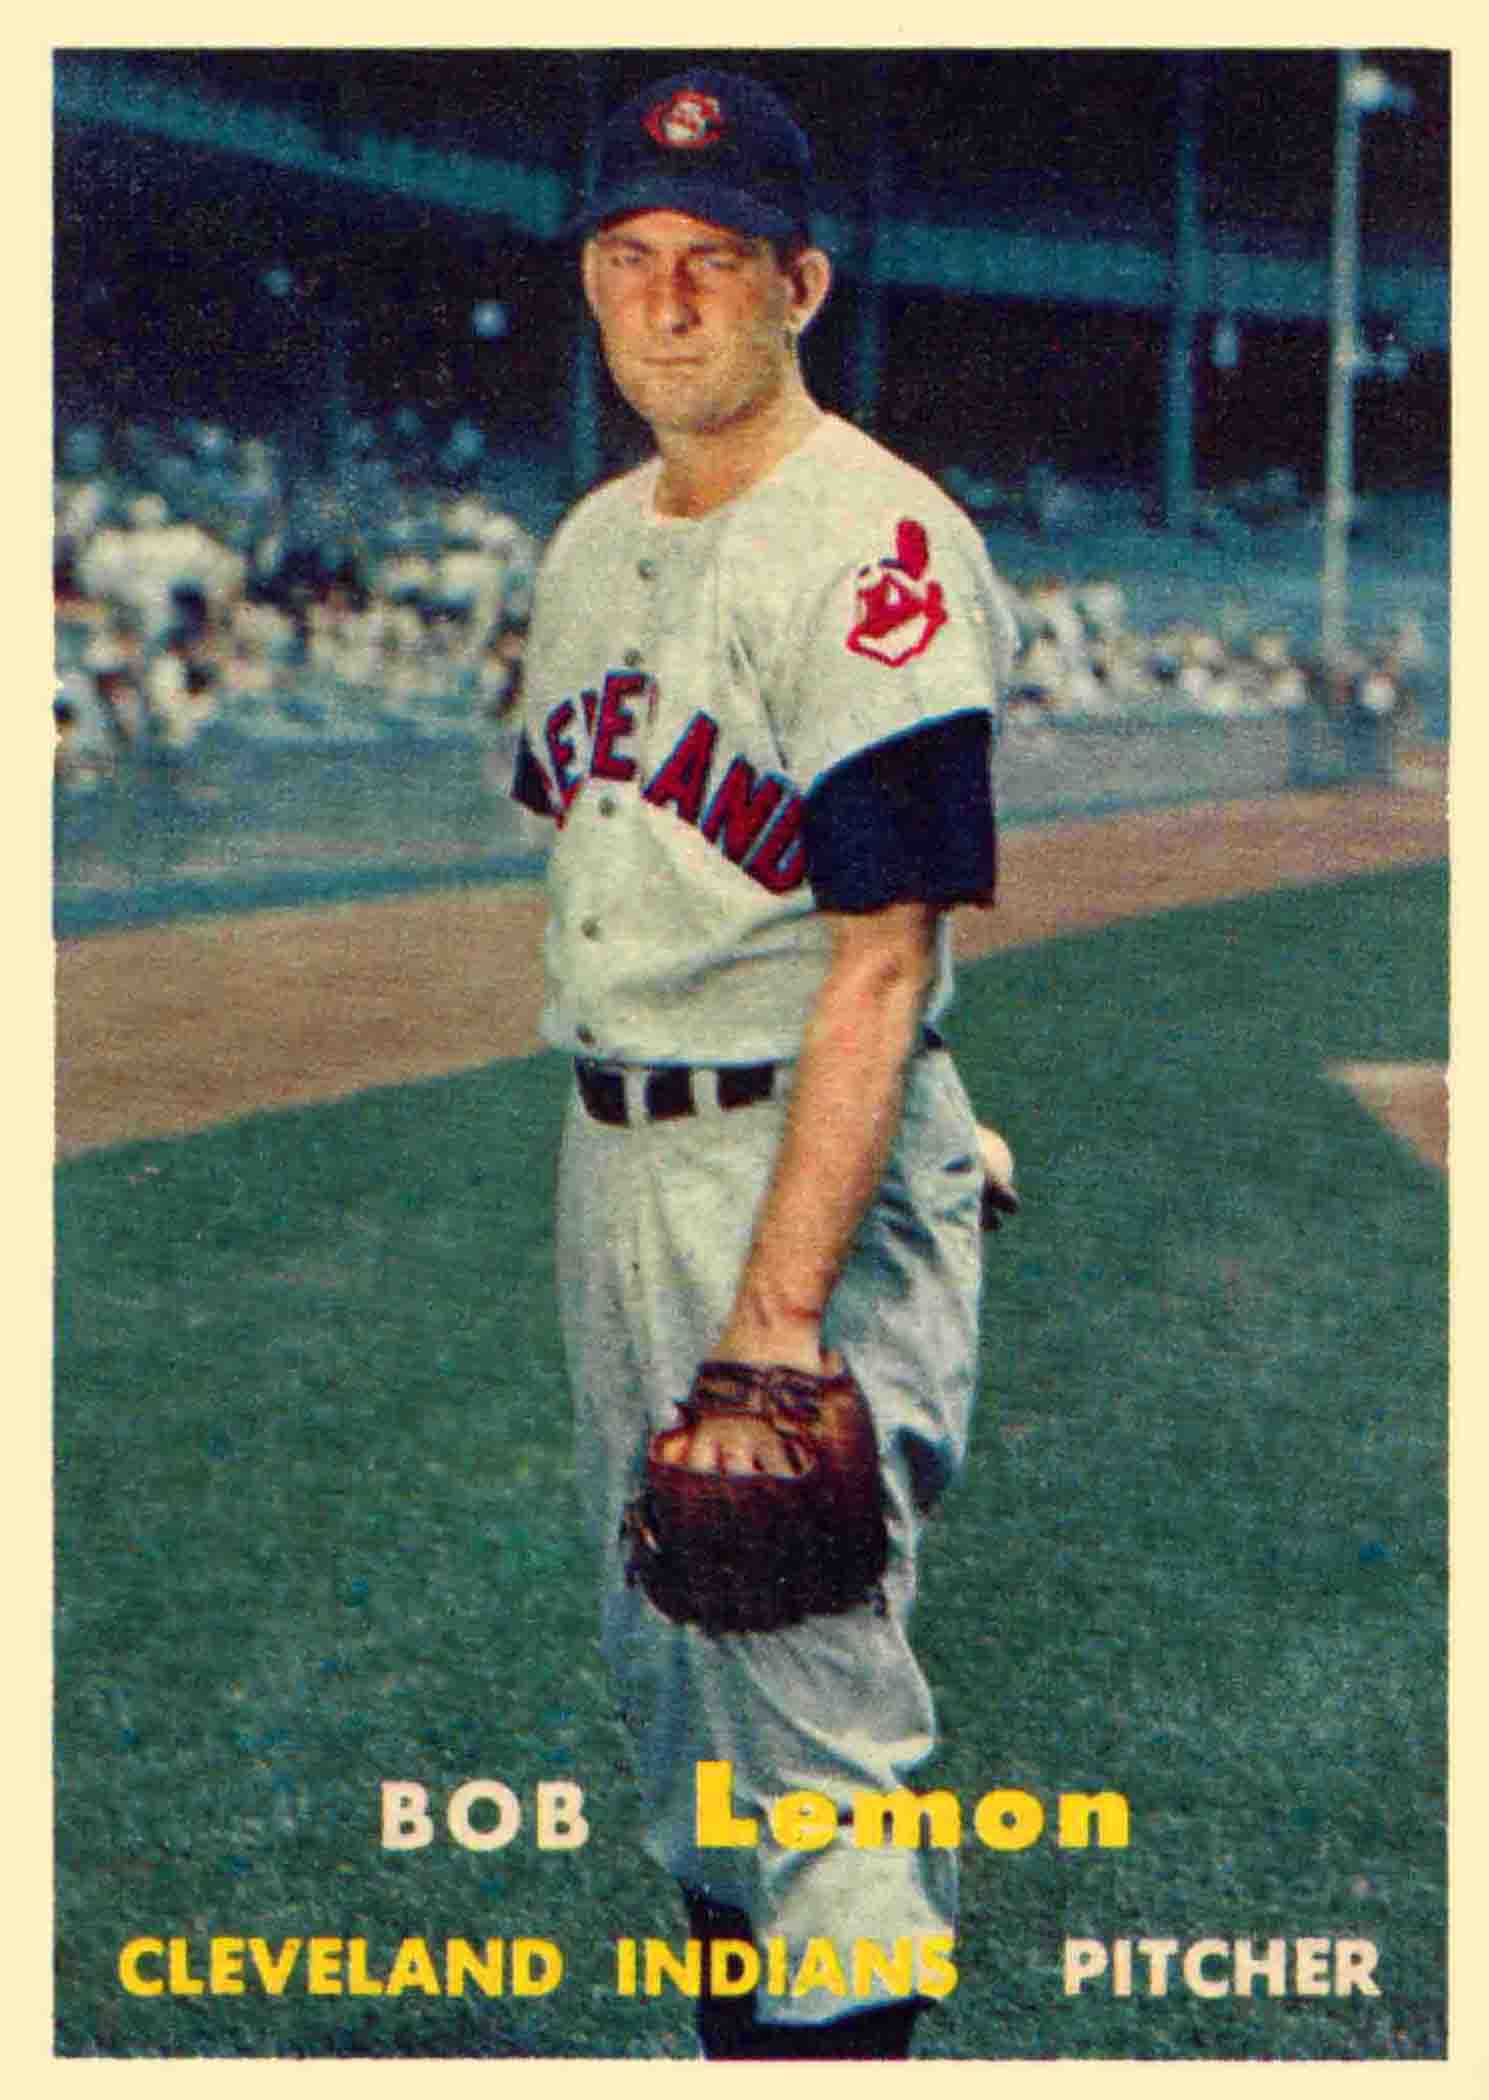
Bob Lemon was the American League’s dominant pitcher of the 1950s.
.jpg)
Mickey Mantle was, well, Mickey Mantle.
Mickey Mantle is unquestionably the greatest switch hitter of all time. A lifetime .298 batting average he hit a home run every 15.11 at bats. He had a lifetime on base percentage of .421 and slugged at a .557 clip. A free swinger who once said he tried to hit every ball pitched as far as he could, he struck out once every 4.73 at bats. He is arguably baseball’s most legendary player!
On his way to the Hall of Fame, Bob Lemon’s opponents hit .237 against him. Not really a strike out pitcher, he fanned one batter for every 8.45 he faced. He did not surrender a lot of home runs as opponents hit one out of the park every 59.95 times they came to the plate. The on base percentage of his opponents was .320.
They faced each other 119 times with Mick hitting but .202 against him, 96 points lower than his lifetime average. His .317 on base percentage was 104 points below his mark while his slugging percentage of .395 was 162 points short of his mark! Mantle hit 6 homers off of Lemon for a home run to at bat ratio of 1 per 19.8 at bats, a nearly five at bat difference than his lifetime stats. What did remain constant was his strike out ratio as Lemon got him once every 4.58 at bats.
Looking from Lemons perspective, Mick hit 35 points lower than his opponent’s lifetime batting average and 3 points lower in his on base percentage. He struck Mickey out at double the rate of his career average, but Mickey clipped him for a home run with a ratio that was 3 times better than Lemon’s average!
Conclusion? This is pretty good circumstantial evidence supporting Mantle’s claim that he tried to hit every pitch as far as he could. He made no adjustments and simply gripped and ripped. The reality is that Bob Lemon reduced the great Mickey Mantle to Dave Kingman!
How about Bob Gibson and The Hammer?

Bob Gibson was one of the games most feared pitchers.

Many still consider Hank Aaron, baseball’s all-time home run leader.
My favorite Bob Gibson stat is that he started 9 World Series games in his career and has pitched 81 World Series innings. Now it is a tad deceiving because you look at that and say “Good Lord, nine complete games.” Well it’s only 8. Catch that ONLY 8. In game two of the 1964 World Series he ONLY went 8 innings but he made up for that in Game five with a complete game 10 inning win.
“Gibby” won 251 games and often did so in dominating fashion. His opponents hit but .224 against him and he surrendered a home run every 56.92 at bats. He struck out a batter every 4.69 at bats and the on base percentage of those he faced was but .294.
For the better part of two decades, Hank Aaron was one of baseball’s most consistent hitters. A lifetime .305 hitter he cracked a homer every 15.4 at bats. His on base percentage was .374 and he slugged at a .555 clip. He only struck out once per 8.99 at bats.
Bob Gibson handled Hank Aaron similar to the way Bob Lemon handled Mickey Mantle. In 163 career at bats versus Gibson, Aaron hit .215; 90 points below his career average and 9 points below what Gibson’s opponents batting average was throughout his career. Hank could muster but a .278 on base percentage against the Cardinal great; 96 points lower than his own lifetime mark and 16 points lower than what Gibson fared against his lifetime opponents. The all time home run king nicked Gibson for 8 home runs but that averages to 1 for every 20.38 at bats, a full five at bats more than his lifetime mark and Aaron struck out once every 5.09 at bats with Gibson on the mound, a nearly four at bat differential than his career mark.
There are precious few pitchers that can lay claim to the fact that they “dominated” Hank Aaron, but without question Bob Gibson is one of them.
But then again, Gibson dominated Mays and Clemente and Bench and Perez and Schmidt and Frank Robinson and Duke Snider and….well you get my drift.

Negro League greats Satchel Paige and Josh Gibson.
Unfortunately, there are no definitive stats that can tell us how Satchel Paige and Josh Gibson fared against each other; and thus that match up has to live in the imagination. However I was fortunate enough to be present at the dedication of the Buck O’Neil Sports Complex in Sarasota Florida when Buck relayed a story he often told about the sound of a bat hitting a baseball. He said that he heard the “special” sound three times and it came from the bats of Babe Ruth, Josh Gibson and Bo Jackson!
I suspect that Josh Gibson and Satchel Paige would, like Walter Johnson and Babe Ruth, reduced each other to mere mortals.
CHECK OUT THE UPDATE

Hi Raymond…most of my life (I am now 80) I have wondered how ,my favorite, Ted Williams had done aganist the great Bob Feller. Thank you very much for this information…
Roy Arvio
You are welcome Roy…..Thanks for your support!!!!
Just wanted to say thanks for compiling the numbers for some of Baseball’s great confrontations. I have been looking for the Ruth-Johnson stats forever. The outcome of probably the two best at their craft seems about right – “Good pitching will always stop good hitting and vice-versa.”
Thanks for your kind words. Glad you found them.
As far as Walter vs Babe…….Babe did not face Walter probably, until at least 1915, and for three years, he didn’t face him much, because Babe was a full time pitcher, playing only about 40 full games per year. IN 1918, Babe was still not a full time player. Walter was past his prime by 1920, and had only one great year after that. Even that year, his ERA+ was “only” 147. In the years before 1920, ending with 1919, his ERA+ numbers were 243, 259, 164, 191, 147, 120, 214, 215. Think about this: Sandy Koufax, in his best years, never reached 200. Starting in 1920, Walter averaged about 119 for the remainder of his career. So the majority of Babe’s At Bats against Walter were in the live ball era (starting in 1920) when Walter wasn’t Walter anymore. that’s the main reason Babe did as well as he did against the Big Train.
Good point Joey, but all we have is what was; not what might have been. True in all parts of life. And you will be happy to know that the Baseball Academy of Statistical Excellence (B.A.S.E.) ranks Walter Johnson the most DOMINANT, most VALUABLE, most PRODUCTIVE pitcher of all time. Thanks for your input.
Often wondered how Ted Williams would have fared against Sandy Koufax.
Bob Feller said Herb Score would have been better than Koufax, because his curve was just as good (Koufax had what is regarded as perhaps the best curve ball ever), and Score’s fastball was better. Of course he did bot have the pinpoint control Koufax had, and he was injured early in his career, contributing to a shorter time as a dominant pitcher.
Knowing how similar the two pitchers were, it is interesting to compare Ted’s stats against Score, as a way to project how he may have done against Koufax. While I do not have the exact stats, I have heard Ted Williams dominated against Herb Score.
Do you have the stats?
Thanks Bob. Ted’s numbers against Score were interesting. He only hit .240 against him (6-25) which is .104 lower than his lifetime average. However four of his six hits were homers. He struck out twice and walked nine times. His OBP was .441, .041 lower than his all-time leading .482. Feller may have been correct as Score exploded on the scene at 22 and dominated. It took Koufax six seasons to find himself.
Yes….six wasted seasons when Koufax had a strong healthy arm but couldn’t find the strike zone..once he found himself he had a chronically inflamed elbow and pitched the rest of his short career in significant pain…he would have been considered after W Johnson as the most dominant pitcher of his time if not for that elbow!!!
Robert, and yet he STILL was in the top 10 of the most dominant, most valuable, most productive pitchers of all time. Keep your eye here, a new book will be out soon about an evaluation system which tells us exactly that! It’s called B.A.S.E. the Baseball Academy of Statistical Excellence!
Babe hit ten verse Johnson
Thanks Hal, you’ve inspired me, stay tuned.