This one is for baseball coaches at every level.
I have been knocking around a baseball field with kids for the better part of three decades. They have ranged in age from five to 20, from T-Ball to high school. And there is a familiar thread that exists at EVERY LEVEL. And that is the players expectations of their success rate with a bat in their hands. We have all seen it, dealt with it and attempted to ameliorate it.
It was the early 1990s when I was coaching in Little League and Ken Griffey Jr was the best player in the baseball. When I would ask the kids how many hits they thought he got in ten at bats, the lowest number I received as an answer was seven! SEVEN! They perceived Junior as a .700 hitter.

By the time they reach high school they realize that’s impossible (most of them) but it does not seem to translate to them that it is simply impossible.
We all have witnessed the emotional upheaval caused by that young player who does not meet expectations from either daddy, mommy, or above all themselves. This compounds the difficulty of a game that is brutally difficult to begin with.
I offer this today as a tool to bring young players to the realization to the degree of difficulty in this greatest of games. Coming to this understanding is the first step in the development of the mental toughness required to function at their best.
I have often stated that baseball is the most difficult of all the sports to play. If you doubt this, consider the following. We begin with this guy,

Tyrus Raymond Cobb
Nobody was more adept with a bat in his hands than Ty Cobb. Cobb played for 24 seasons. He was the batting champion in 12 of those seasons, including a record nine in a row. For over six decades he was the all-time hit king having amassed 4189 hits in his career. In his rookie season of 1905, he played in 41 games with the Tigers and hit .240. The next 23 seasons he hit over .300. Included in that were back to back years in which he hit .420 and .409 and three straight years when he hit .383, .382 and .384. When he left the game following the 1928 season he did so with a lifetime batting average of .366. It remains today the highest lifetime batting average in the history of the game.
Pretty impressive huh?
Now considered this; in his 11,434 official at bats he made 7,245 outs. So that means his at bats ended in an out 63.4% of the time. Or we can say his out average was .634. Let that sink in for a minute.
He failed nearly twice as much as he succeeded.
Now, let’s take a look at this guy.

Cotton Davidson
Confused? You won’t be. Cotton Davidson sits in the 181st position for career completion percentage for NFL quarterbacks. In a 14 year career he completed 43.9% of his passes.
He failed 56.1 % of the time to meet his objective.
How about this guy?

Shawn Marion
In a 16 year NBA career, Shawn Marion had a shooting percentage of .484 good enough to rank 250th on the all time career list.
He failed 51.6% of the time.
A quick recap, if THE BEST average hitter of all time had succeeded at the same rate as the worst NFL quarterback of all time he would have hit for a .439 lifetime batting average. NOBODY ever hit that high in one season. And if the BEST average hitter of all time had succeeded at the same rate as the worst NBA shooter of all time he would have hit at a .484 lifetime clip.
The absurdity of a baseball player hitting .439 or .484 in a season has all of you baseball aficionados smiling.
Baseball’s last .400 hitter may well be on to something.

Ted Williams hit .406 in 1941 and is sixth on the all time average list with an average of .344.
And what he was on to can be simply explained. Standing in a batters box 60 feet 6 inches from the pitcher, the batter holds in his hands a bat, made of wood. The bat is barreled and is round and smooth. The pitcher releases the ball at varying speeds which will range approximately 20-25 mph in their variations, depending upon the given pitcher. Big league pitchers can range from the high 60s from the knuckleballer to fastballs touching 100 mph.
The fast ball gives the batter the luxury of about 1/4 of a second to see, identify and swing his round object at the round baseball on his way.
Catch my drift?
As of today, 18,663 players have played Major League Baseball, and of all those a grand total of 178 of them have achieved a lifetime batting average of .300 or higher.
Now let that sink in for a second. The percentage of players to achieve the lifetime .300 mark is 0.009%! That is less than 1%. Thirty-seven of those players are over the .325 mark, twenty-four have hit the coveted .333 lifetime average, fourteen are over .340 and only THREE (including Cobb) are above .350.

Rogers Hornsby hit .358 in 23 seasons.

The ill-fated “Shoeless” Joe Jackson hit .356 in his 13 year career.
There are nine active players who are currently hitting higher than .300 throughout their careers.
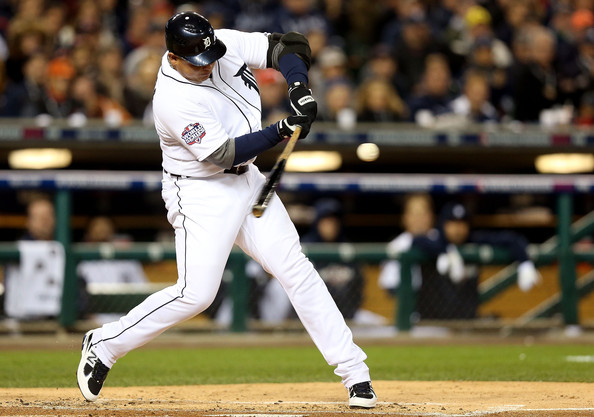
Miguel Cabrera leads the active players with a .321 lifetime average. He is entering his 14th season.
All that said, perhaps the argument can best be made by looking at the top 1000 career averages in the history of the game. What would you guess the lifetime batting average is of the player who is 1000 on the all time average list? Think about that before proceeding and make your best guess
And before we get there, here he is.

Pat Kelly played 15 years from 1967-1981.
This morning he occupies Baseball Almanac’s 1000th spot on the list of Major League player’s batting average. Now before I give you his average, contemplate this fact; he is in the top 5.3% of batting averages.
He hit .264 lifetime, so conversely his out average is .736! He failed to get a base hit 73.6% of the time and he is among the top 5% in his success rate as a hitter.
Each player is an individual with varying expectations of what they wish to accomplish, These facts may help them make that first step in understanding that the very best who played this game, at its highest level, failed with a bat in their hands between 63 and 74% of the time.
Good luck!
And so it is on this day in baseball history, Coaching tip Day. February 28th, 2016.
